Visualization of the resonance graphs of benzenoid graphs
Here we describe a computer program that generates and visualizes the resonance graphs of catacondensed benzenoid graphs.
This is the homepage of computer program for visualization of the resonance graphs of benzenoid graphs. It's written in Turbo Delphi Explorer and uses advanced visualization techniques.
Authors: Igor Pesek and prof. dr. Aleksander Vesel
Email: Igor Pesek and Aleksander Vesel
Download free copy of this program HERE.
Current version: 1.0, Dec. 1st 2006
So What is This About?
The drawing of complex molecules as well as the drawing of the related conceptual structures is a crucial element
in many computer chemistry applications.
Graph drawing algorithm is a method to produce graph drawing that meets some aesthetic criteria.
Since aesthetics frequently conflicts with each other, the most graph drawing algorithms set up a precedence relation
among aesthetics.
In order to establish a suitable precedence, it is often important to take into account the class of graphs
to which a graph that needs to be drawn belongs. The specialized drawing algorithms then usually works better on
the corresponding class of graphs than more general ones.
Moreover, beside producing a more readable drawing, a tailor-made drawing algorithm can also illustrate the combinatorial properties of a graph.
Using the program
To draw a resonance graph we need to execute few steps.
- In first step we need to choose the catacondensed benzenoid graph by clicking in hexagonal grid on hexagons and model the structure that we wish to observe.
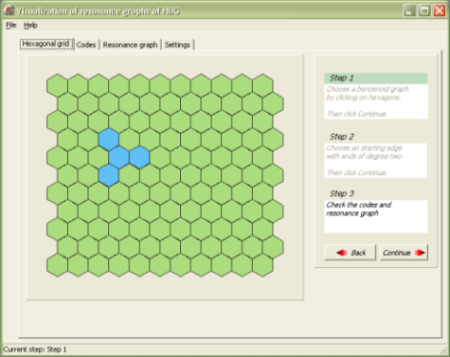
- By clicking on continue, we proceed to next step, where we choose an starting edge with ends of degree two. This is acomplished by clicking on edge of blue hexagons, that represent our structure.
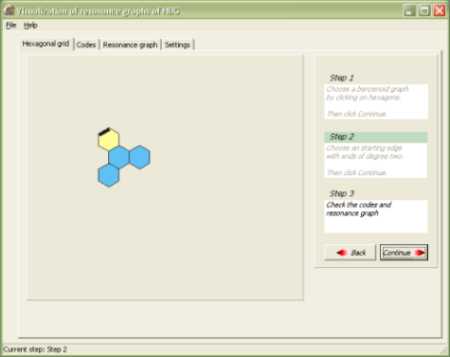
- With clicking the Continue button, the program computes the codes (1-factors), which can be inspected on tab named Codes. The program automatically opens the Resonance graph tab containing the resulting graph.
There is also fourth tab named Settings, where we can set following options:
- show grid, turns in/off the grid of lines, which are helpful when moving points
- grid spacing, determines width and height between grid lines
- snap to grid, turns on/off snaping of points to grid when moving them with mouse
- snap sensitivity, defines the radius where points will be snaped to grid junctions
- edge length, defines how long will be primary edges in drawing
- draw Hamilton path, turns on/off the Hamilton path drawn into the resonance graphs
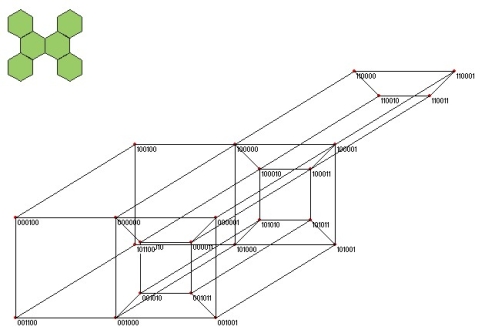
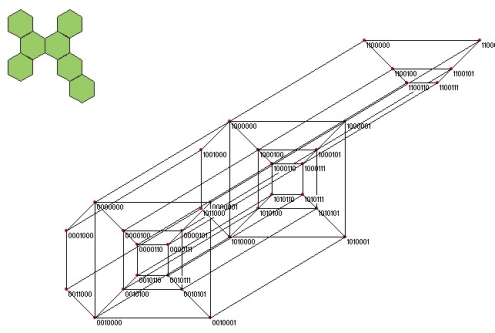
Examples
Here are some examples of catacondesed benzenoid graphs and their correspoding resonance graphs:
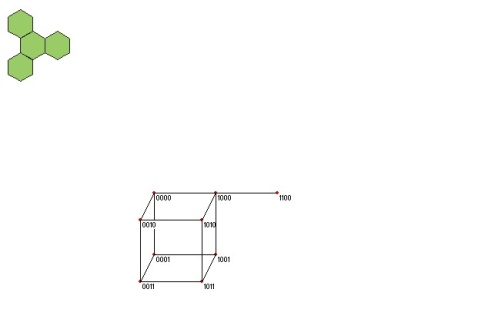
Example 1
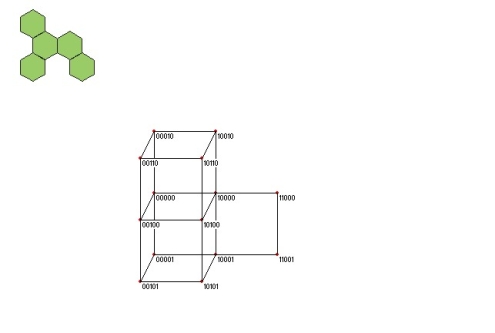
Example 2
Example 3
Example 4
Requirements
In order to use this program, Windows XP and reasonably fast computer are requiered.
References
- S. Klavžar, A. Vesel, P. Žigert, On resonance graphs of catacondensed
hexagonal graphs: Structure, coding, and Hamilton path algorithm. Match
(Krag.), 49 (2003). - A. Vesel, Characterization of the resonance graphs of catacondensed
hexagonal graphs, manuscript. - S. Klavžar, A. Vesel, P. Žigert, I. Gutman, Binary coding of Kekulé structures
of catacondensed benzenoid hydrocarbons, Computers & Chemistry 25
(2001).
- W. Imrich and S. Klavžar, Product Graphs: Structure and Recognition (John
Wiley & Sons, New York, 2000).
- D.L. Kreher, D. R. Stinson, Combinatorial algorithms: Generation, Enumeration
and Search (CRC Press, Boca Raton, 1999).